

Filters
You can filter events by:- Date Range
- Events – Filter by event name or type.
- Ref – Search by event reference.
- Customer Alias – Locate events associated with a specific customer.
Overview
Use event search to query and filter usage events recorded in Vayu. This allows you to analyze customer activity, verify metered usage, and troubleshoot billing discrepancies.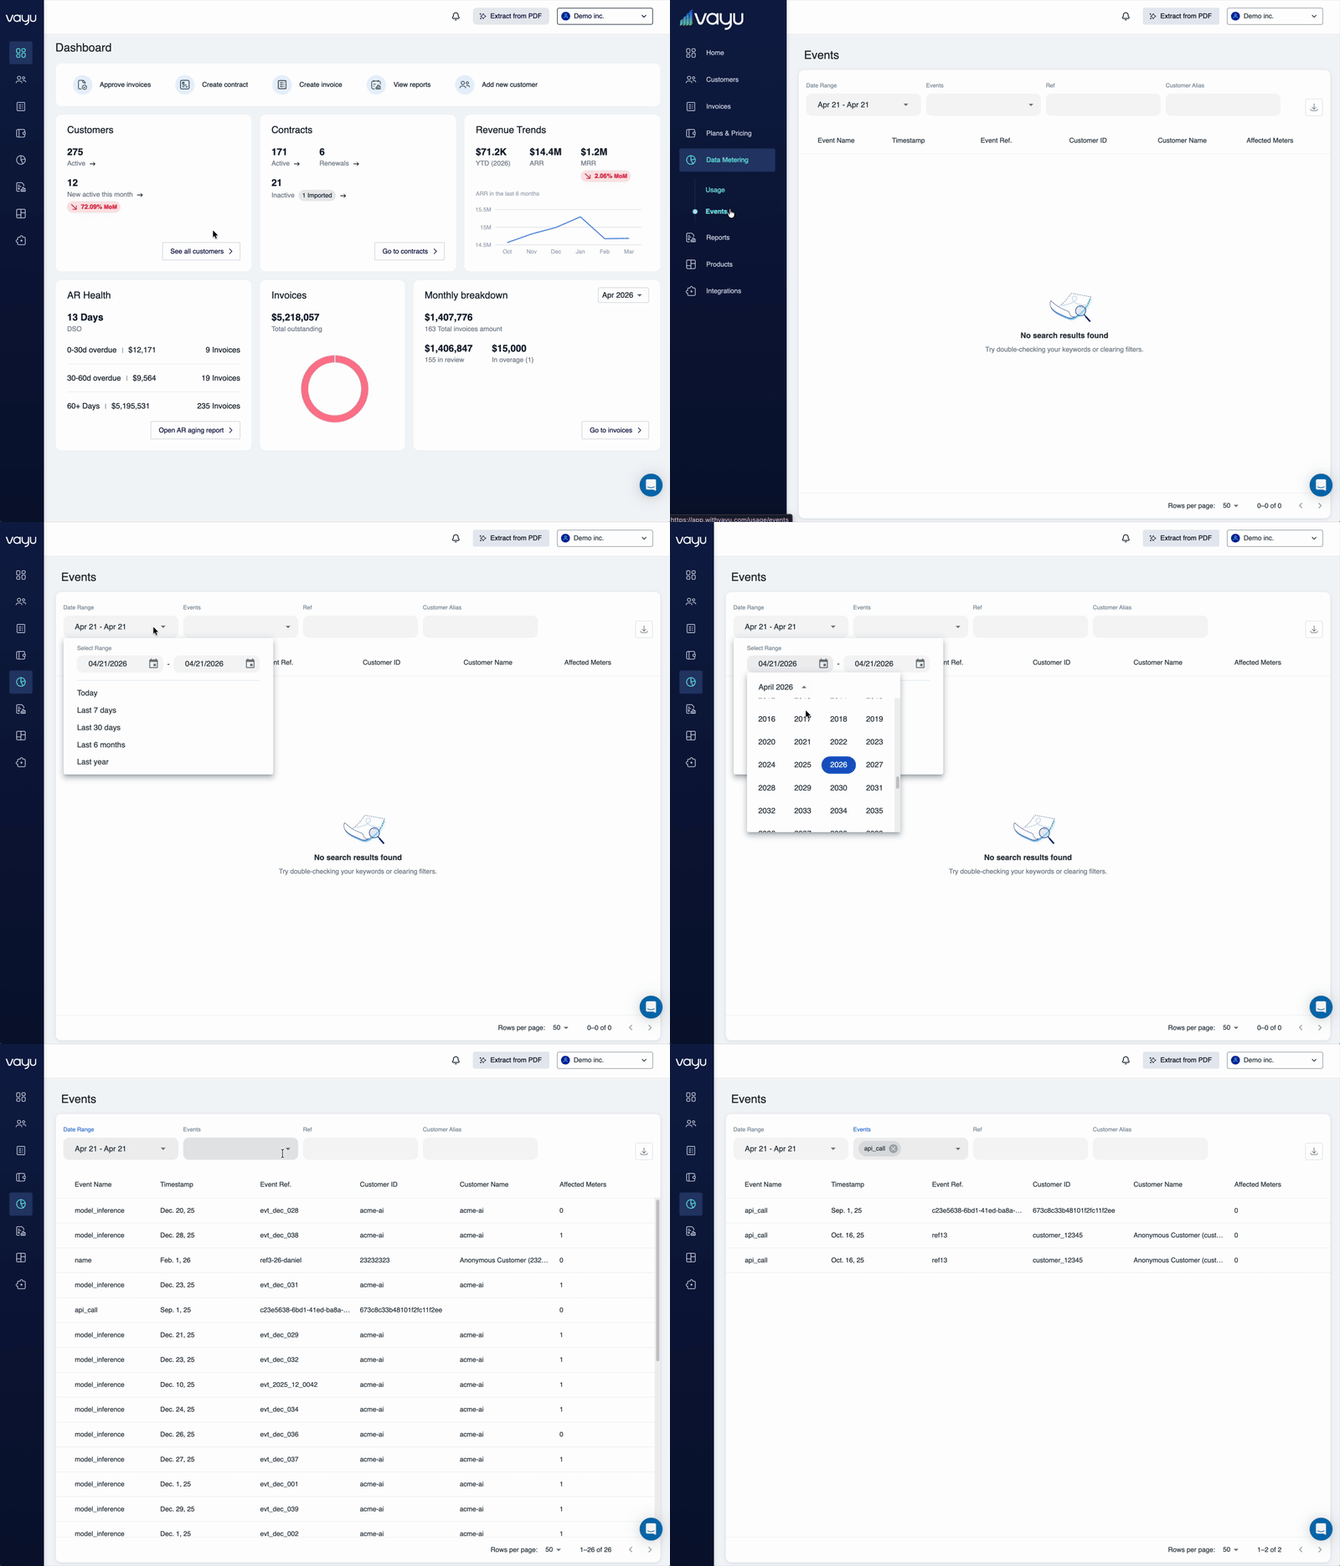
Search Events
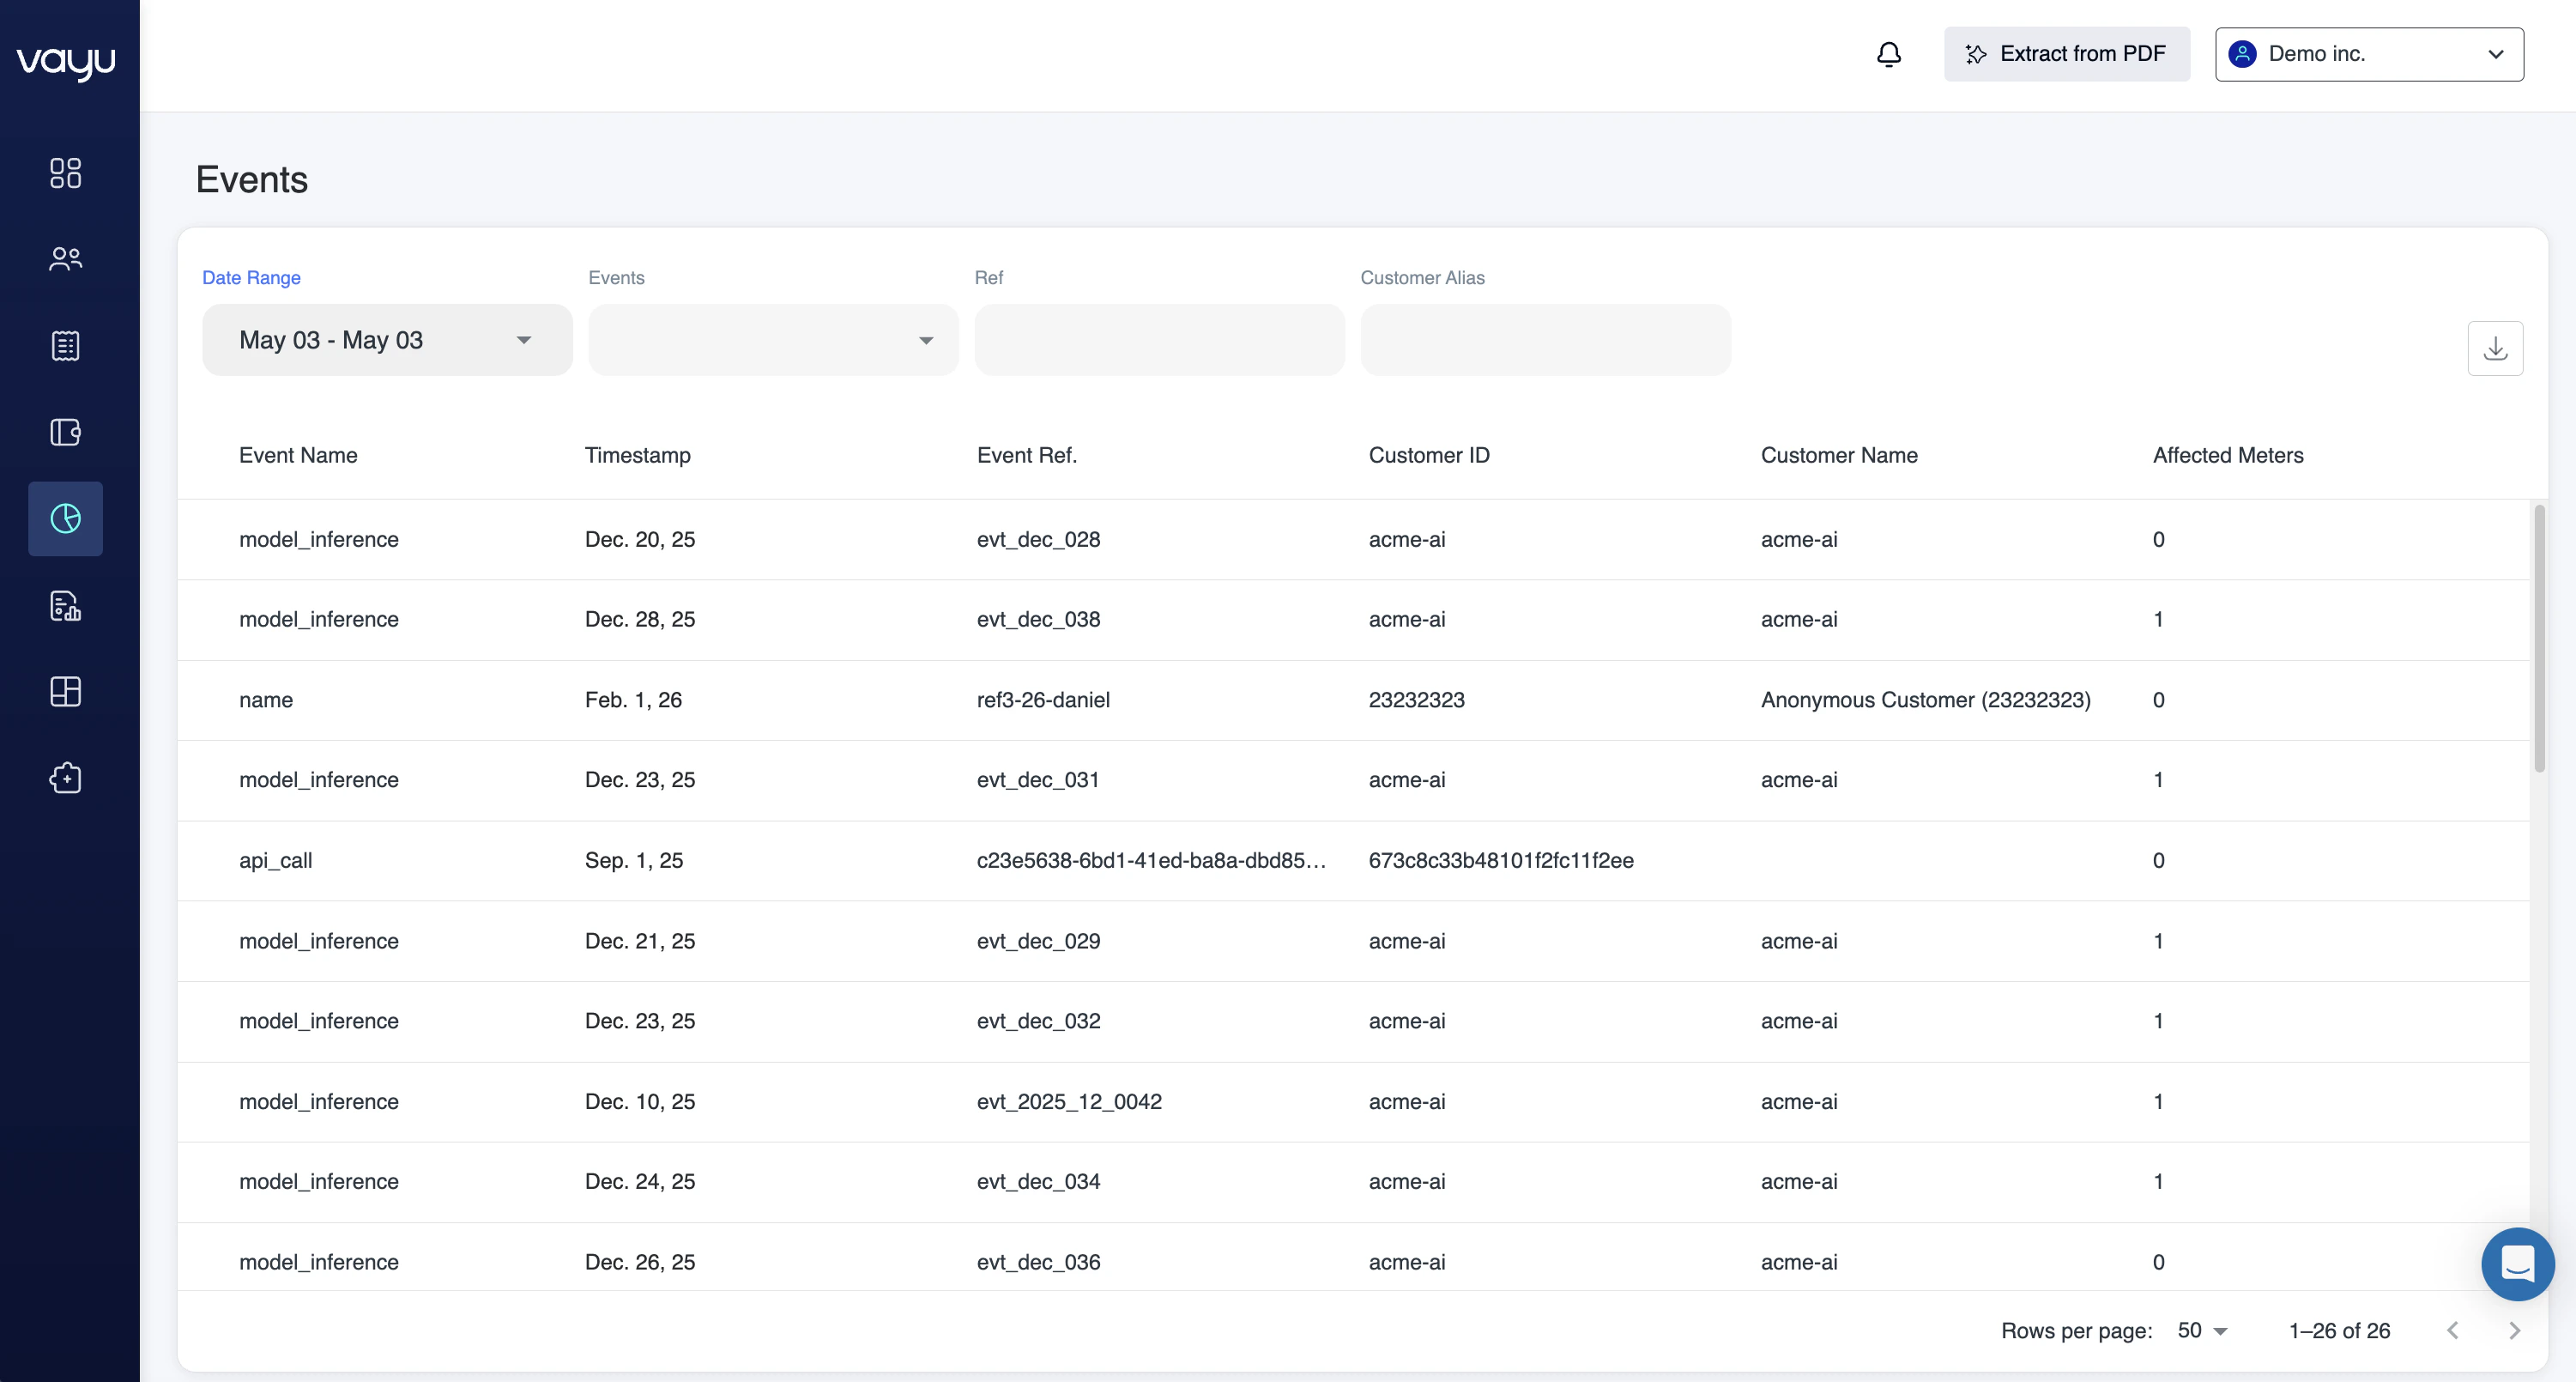
Use event search to query and filter usage events recorded in Vayu. This allows you to analyze customer activity, verify metered usage, and troubleshoot billing discrepancies.Searching events through the UI
To view events in the Vayu interface:- Navigate to Usage in the left-hand navigation
- Click Events
- View the latest 100 events recorded in the system
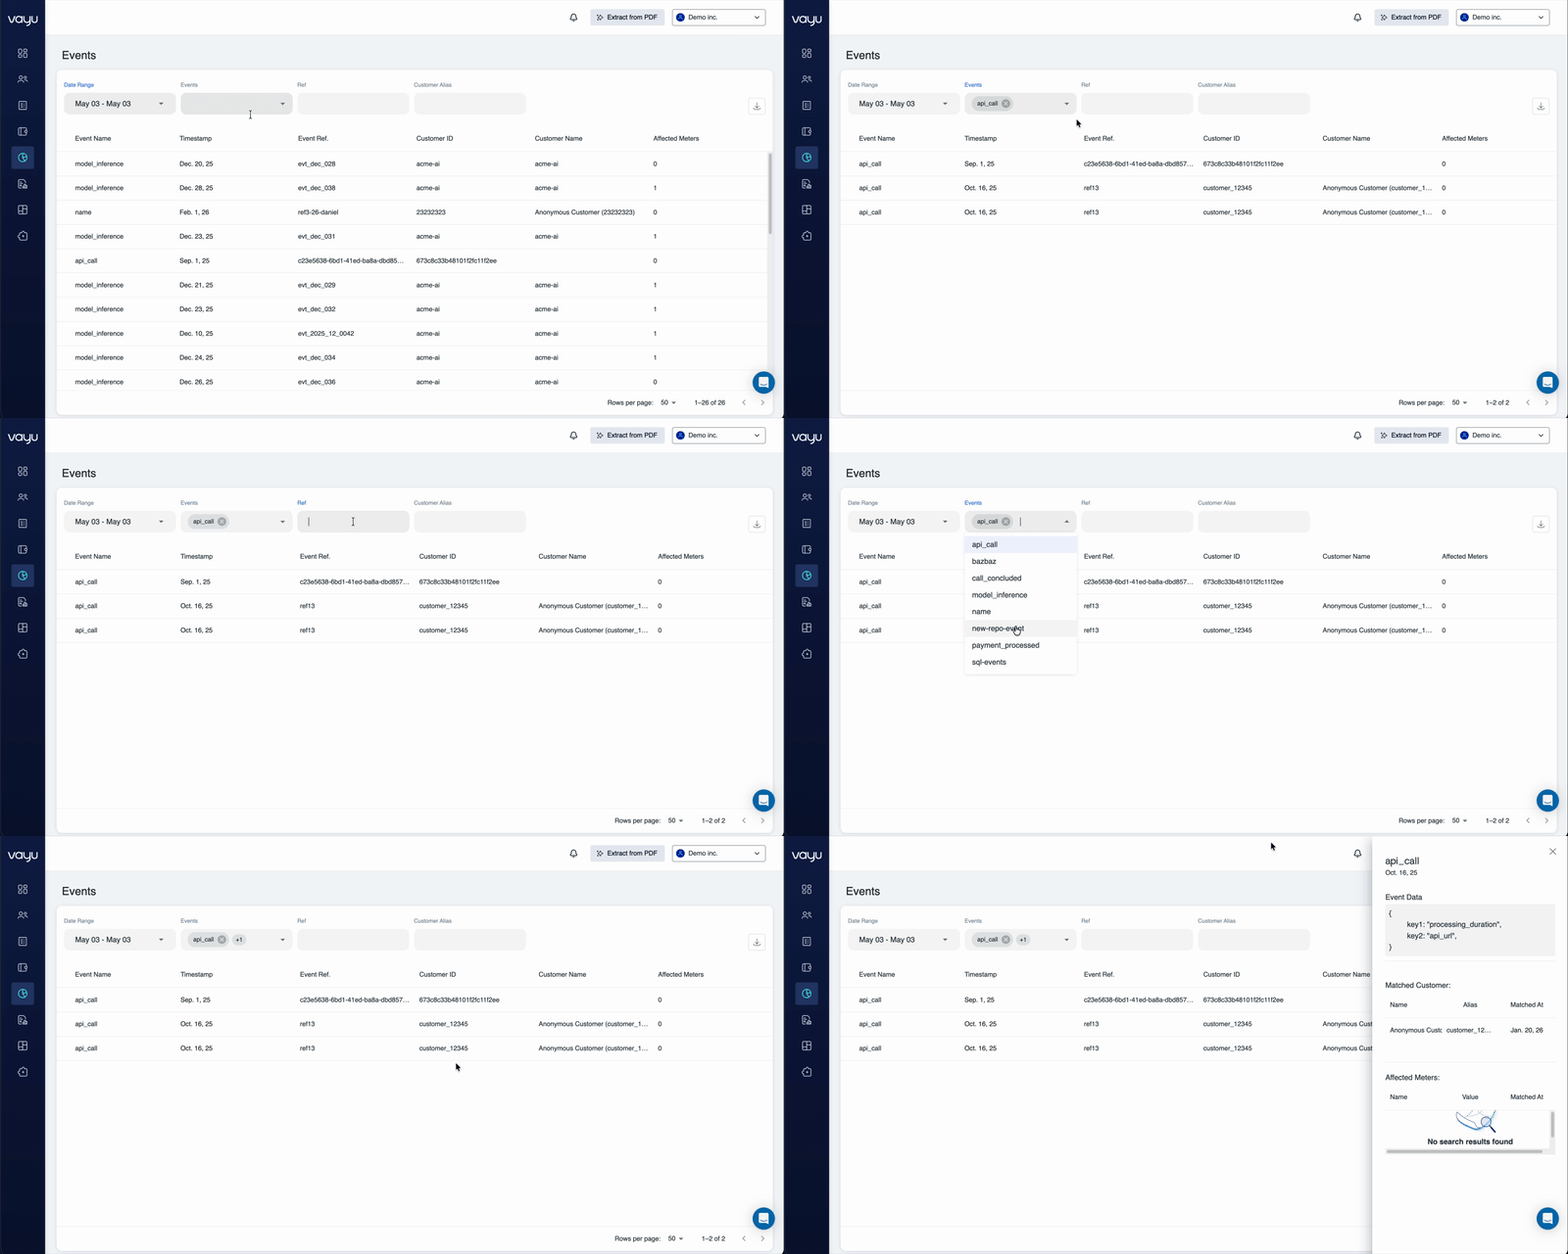
- Event name
- Timestamp
- Customer alias
- Event reference ID
- Event data and properties
Searching events through the API
For more advanced filtering and larger result sets, use the API to query events.Query events endpoint
Example response
Common search scenarios
Find events for a specific customer
Query events by customer alias and time period to see all activity for that customer:GET /events?startTime=2023-11-01T00:00:00Z&endTime=2023-11-30T23:59:59Z&customerAlias=customer_12345
Verify usage for billing period
Search events within a billing period to verify metered usage before invoice generation:GET /events?startTime=2023-10-01T00:00:00Z&endTime=2023-10-31T23:59:59Z&eventName=compute_hours
Troubleshoot missing charges
Query events by event name to identify if usage was recorded but not billed:GET /events?eventName=storage_gb&startTime=2023-11-01T00:00:00Z&endTime=2023-11-30T23:59:59Z
Analyze usage patterns
Retrieve large datasets to analyze usage trends and patterns:GET /events?startTime=2023-01-01T00:00:00Z&endTime=2023-12-31T23:59:59Z&limit=1000
Event availability
Events are immediately available after submission:- Real-time visibility - Events appear instantly in both UI and API
- No processing delay - Query events as soon as they’re recorded
- Immediate analysis - Monitor and act on incoming data in real-time
Pagination
For large result sets, use cursor-based pagination:- Make initial request with
limitparameter - Response includes a
cursorvalue - Use cursor in next request to retrieve additional results
- Continue until no more results are returned
Best practices
- Use time ranges - Always specify startTime and endTime to limit result sets
- Filter by event name - Narrow results to specific event types when possible
- Set appropriate limits - Balance between result size and number of API calls
- Store cursors - Save pagination cursors to resume queries
- Monitor in real-time - Use event search for live monitoring and alerting
Pricing Events
Pricing events, also called measurements, are the raw usage data points you send to Vayu to power usage-based billing. Each event represents a billable action or consumption that occurred in your product. Pricing events are individual records of customer usage that include:- Event name - The type of usage being measured (e.g., “api_call”, “storage_gb”, “seats”)
- Customer identifier - Links the event to a specific customer
- Timestamp - When the usage occurred
- Quantity - The amount of usage (e.g., 1 API call, 50 GB storage)
- Metadata - Additional context like region, product tier, or feature flags
Ingestion
API ingestion
Send events directly to Vayu’s ingestion API:Batch ingestion
For high-volume scenarios, send events in batches to reduce API overhead.Data warehouse integration
Connect your data warehouse to automatically sync usage data to Vayu on a scheduled basis.Event processing
Once ingested, pricing events flow through Vayu’s processing pipeline:- Validation - Events are checked for required fields and data integrity
- Enrichment - Customer and product data is attached to each event
- Aggregation - Events are grouped and summed according to your pricing configuration
- Rating - Aggregated usage is converted to billable amounts based on pricing tiers
- Invoicing - Rated usage appears on customer invoices
Event requirements
Each pricing event must include:- Unique event ID - Prevents duplicate processing (idempotency)
- Customer identifier - Maps to a customer in Vayu
- Event name - Matches a configured pricing metric
- Timestamp - Must be within the acceptable time window
- Quantity - Numeric value representing the usage amount
Best PracticesWhen sending pricing events:
- Send events in real-time - Minimize delay between usage and event ingestion
- Use idempotency keys - Prevent duplicate charges from retry logic
- Include rich metadata - Enable detailed usage analysis and debugging
- Batch when appropriate - Balance real-time visibility with API efficiency
- Monitor ingestion - Track event delivery and processing errors
- Test thoroughly - Verify events are correctly mapped to pricing metrics
Viewing Pricing Events
You can view ingested pricing events in the Vayu dashboard:- Navigate to Usage Data
- Select Events or Measurements
- Filter by customer, date range, or event type
- Review event details and processing status